

About the Author
Mr. Smith has over a decade of experience, with a specialization in relief systems design and documentation, PSM compliance audit reviews, heat and material balance generation, PHA concern resolution, and flare system integration and optimization. Dustin is a chemical engineering graduate of Texas A&M University, a licensed Professional Engineer in Texas and LOPA certified.
A recent Smith & Burgess webinar discussed the operation of direct spring-operated relief valve devices in vapor service. In that presentation we discussed how the valve internals and the service fluid can affect the performance of the relief device. Our co-presenters on the webinar, from Baker Hughes, the manufacturer of the Consolidated relief valve line, confirmed that the valve internals affect the performance of relief devices.
The following shows experimental data that highlights performance variability of a single relief valve for various blowdown ring positions. Smith & Burgess Laboratories has purchased ten API 526 relief valves that had all been repaired and delivered with the RV’s seals intact. Upon inspection, we found that the position of the blowdown ring ranged quite a bit. The following definitions for blowdown settings are used for this article:
Long Blowdown – This would be when the manufacturer or repair shop assembles the relief valve such that the blowdown ring is positioned at the top of the nozzle, near the disk (denoted by low numeric values for ring position in the figure below). This assembly tends to result in the relief device having a faster opening time but being more stable.
Short Blowdown – This would be when the manufacturer or repair shop assembles the relief valve such that the blowdown ring is positioned further down the nozzle, away from the disk (denoted by high numeric values for ring position in the figure below). This assembly tends to result in the relief device having a slower opening time but being less stable.
Test Data
The test data in this update is taken from experiments performed by Smith & Burgess Laboratories on a 1½H3 conventional relief device set at 90 psig on 10 ft of inlet pipe. Using the methods in API STD 520, the inlet pressure losses for this relief device are 4.7% and the outlet pressure losses are 5.0%, based on the capacity of the relief device.
Effect of Blowdown Ring Position on Force Balance Variables
The figure below shows that over the course of the range of adjustments, from 1 notch away from contact to 10 notches away, the opening time, blowdown and initial lift all changed.
- Opening Time –more than doubled, from 27 milliseconds to 62 milliseconds.
- Blowdown – was reduced about half, from 14.2 to 6.1% of set pressure.
- Initial Lift – went from 39% to 26% of the NB-18 listed lift for this relief device
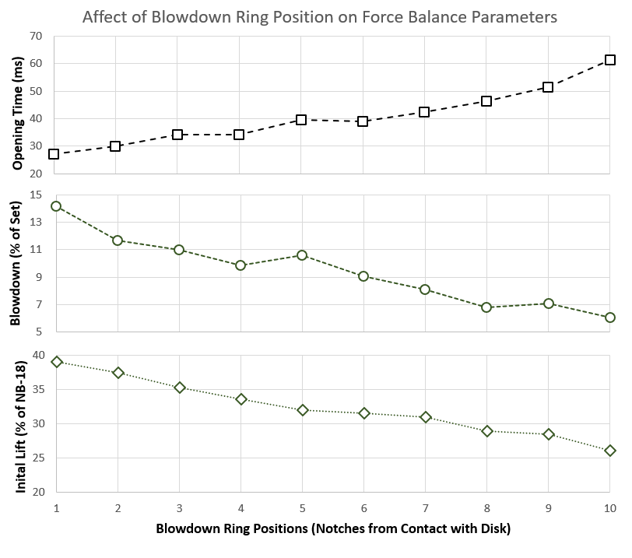
The manufacturer for this relief device recommends that the blowdown ring be set at “4” notches away form contact with the disk; however, of the ten relief valves that we received from RV shops, only two were set per the manufacturer’s instructions. The range of blowdown ring settings in the previous figure was included as it represents values for the relief devices that we received from RV shops. When relief devices were specified to have short blowdowns the repair shops positioned their blowdown rings far from the disk. These assemblies probably functioned fine on the test stand, but did not function properly when subjected to full flow testing.
Effect of Blowdown Ring Position on Stability
Over the course of many tests, we have found that in general a relief device with the blowdown ring closer to the nozzle (e.g. a longer blowdown) is more stable. However, this is not always the case. The following figure shows that the lift trace for Tests 7, 8, and 9 from previous figure, and that the middle test is unstable.
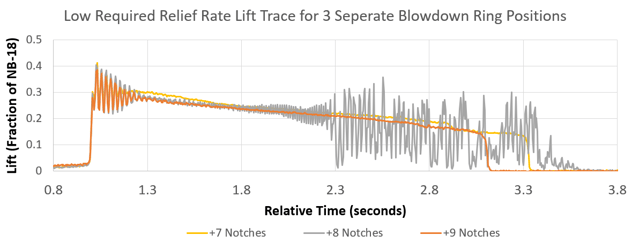
This particular installation was interesting in that stability, for the low demand flow rates, was not correlated with blowdown ring position. However, for the high demand flow rates, stability decreased as blowdown was reduced (i.e., short blowdown was less stable than long blowdown).
Effect of Demand Flow Rate on Stability
Furthermore, for this series of tests, the procedure was to overpressure the system by opening a ½” ball valve, then, once the relief device had reseated, to repeat the test, but to overpressure the system by opening a 2” ball valve instead of the smaller ball valve. Thus, there was a low required relief rate and a high required relief rate for each blowdown ring setting. Without exception, the high required relief demand on the relief valve was less stable than the low required relief rate (for this installation).
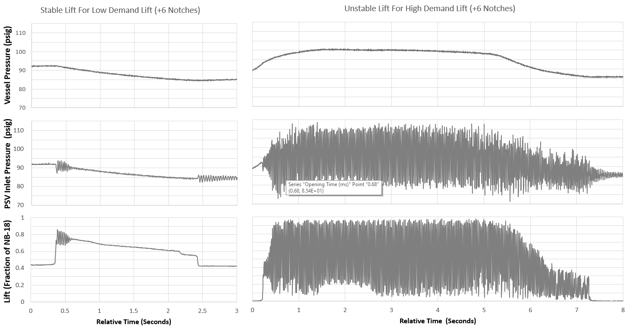
Others have proposed that relief devices are more stable at higher flowrates. Smith & Burgess laboratories has plenty of test data that shows this is not true for all installations, especially for installations with longer inlet lines.
Conclusions
The following conclusions can be drawn from this work.
- The blowdown ring setting has a very important role on the valve performance and affects the parameters that are important for stability.
- When a short (or low) blowdown is required for the application, consider working with the vendor to find an overpressure protection solution that works for your installation. Our review of devices that had a short blowdown specified resulted in the placement of the blowdown ring too far from the disk. These devices were not assembled per the manufacturer's recommendation and demonstrated poor relief device performance (and diminished stability) when subjected to full flow testing.
- When implementing the force balance, be cautioned that "conservative assumptions" on the variables used may not be conservative. Note for this relief device a “conservative” set of assumptions for the force balance resulted in an optimistic assumption set for the acoustic screening. The net result was that the combination of the force balance and acoustical screening deemed the installation stable for unstable blowdown ring settings.
- This set of tests showed that higher flowrates and more overpressure resulted in a less stable relief device. Consider that in an industrial overpressure scenario, analysis calculations yield high flowrates for overpressure events tend to yield lower actual flowrates. Ensure that the mathematical model is consistent with the overpressure and flow rate for the scenario. Note that for complex systems, the relief rate cannot be known in advance.